Detroit's industrial expansion reshaped more than the skyline—it buried centuries of glacial geology beneath miles of fill and pavement. The city sits on a complex sequence of Wisconsinan glacial deposits: stiff clay-rich till overlying layered lacustrine silts and sands from former Lake Maumee shorelines. When a contractor on Gratiot Avenue hits unexpected gray clay at three feet, or a geotech near the Riverfront sees pumping in an excavation, the first question is always about fines content. That's where a proper grain size analysis becomes indispensable. We run the full curve—sieve stack for the coarse fraction plus hydrometer for the fines—because skipping the hydrometer in Detroit means missing critical silt-clay transitions that control drainage, frost susceptibility, and consolidation behavior. Understanding the particle distribution isn't just classification; it's the foundation for every bearing capacity and settlement calculation that follows. Complementing this with Atterberg limits gives us the plasticity context that turns a gradation curve into a real soil profile.
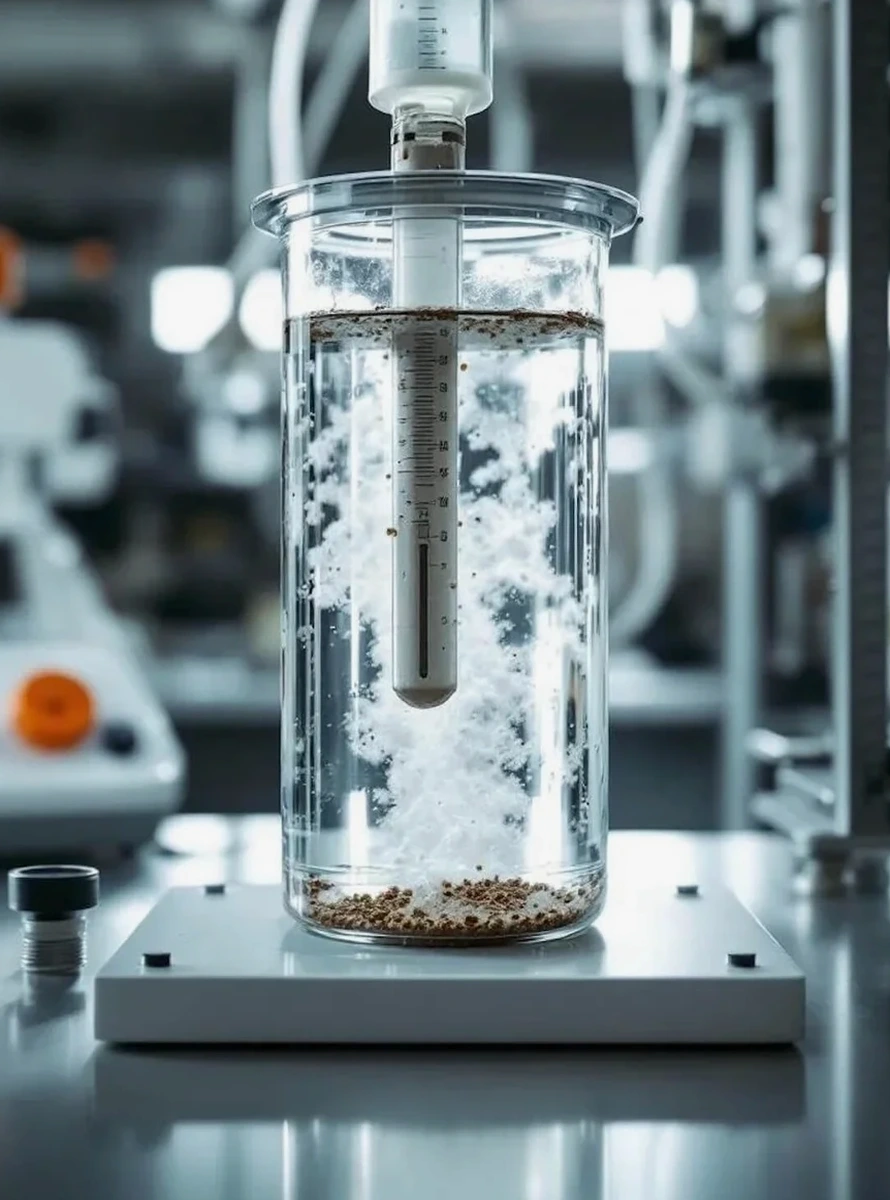
The hydrometer curve below the No. 200 sieve is what separates a stable excavation from a flowing one in Detroit's saturated lakebed silts.
Methodology and scope
In Detroit, we consistently see that the dry sieve alone misleads. The problem is the glacial flour—silt-sized quartz particles that stick to larger grains and resist dry separation. Our procedure follows ASTM D6913 for the coarse fraction and ASTM D7928 for the hydrometer, using sodium hexametaphosphate as the dispersing agent. The combined curve reveals what the naked eye can't: whether that 'clay' layer is actually low-plasticity silt, or if the sand lens contains enough fines to be problematic under cyclic loading. We run wash sieving through the No. 200 (75 µm) before the dry stack, weigh the retained material, and then pull a representative split for the hydrometer sedimentation test. The hydrometer readings at 15 seconds, 30 seconds, 1 minute, 2 minutes, 5 minutes, 15 minutes, 30 minutes, 1 hour, 2 hours, and 24 hours let us plot the full distribution down to about 0.001 mm. For projects near the Detroit River where
liquefaction assessment matters, the percent finer than 75 µm and the coefficient of uniformity (Cu) from this analysis feed directly into the SPT-based triggering correlations. We also collaborate with our
CPT testing crew to calibrate soil behavior type charts against lab-measured grain size, which sharpens the site characterization for deep foundations in the CBD.
Applicable standards
ASTM D6913/D6913M-17: Standard Test Methods for Particle-Size Distribution (Gradation) of Soils Using Sieve Analysis, ASTM D7928-21: Standard Test Method for Particle-Size Distribution (Gradation) of Fine-Grained Soils Using the Sedimentation (Hydrometer) Analysis, ASTM D2487-17: Standard Practice for Classification of Soils for Engineering Purposes (Unified Soil Classification System), ASTM D422-63(2007)e2: Standard Test Method for Particle-Size Analysis of Soils (withdrawn, cited in legacy reports), AASHTO T 88-22: Standard Method of Test for Particle Size Analysis of Soils
Frequently asked questions
Why can't we just use the dry sieve alone for Detroit's soils?
Detroit's glacial tills and lakebed sediments contain abundant silt-sized particles that clump together or coat sand grains when dry. A dry sieve without prior washing through the No. 200 sieve will under-report the fines fraction, sometimes by 10-15 percentage points. That error changes the USCS classification—a 'silty sand' (SM) might actually be a 'clayey sand' (SC) or even a 'silt' (ML). The hydrometer is essential because it quantifies the silt versus clay split, which controls permeability, frost susceptibility, and consolidation rate.
How do grain size results feed into liquefaction analysis for Detroit sites?
The percent finer than 75 microns (%Fines) is a direct input into SPT-based liquefaction triggering procedures per Youd et al. (2001) and subsequent updates. Higher fines content increases the cyclic resistance ratio (CRR) for a given SPT N-value, but only if the fines are plastic clay rather than non-plastic silt. The grain size curve establishes the %Fines, and paired Atterberg limits confirm whether those fines are clay or silt—two parameters that can shift a liquefaction assessment from 'marginal' to 'acceptable'.
What sample mass do you need for a reliable combined analysis?
For predominantly fine-grained soils we require a minimum of 500 grams of material; for granular soils with gravel we need at least 2 kilograms. The sample must be representative of the stratum in question—bag samples from SPT split spoons or Shelby tubes work well. We oven-dry at 110±5°C, break down aggregations with a rubber-tipped pestle, and split to the required mass before washing.
What does a grain size analysis typically cost for a Detroit project?
For a standard combined sieve and hydrometer analysis with full USCS classification and plotted gradation curve, budget between US$100 and US$200 per sample depending on the number of samples and required turnaround time. Rush processing and specialized dispersion for high-plasticity clays may fall at the upper end of that range.